

The “Sunday night scaries” are a well-documented phenomenon among university students, but they take on a much sharper edge when a statistics assignment is looming. For many, the transition from general education to specialized quantitative analysis feels less like a step and more like a leap across a canyon. The pressure to maintain a high GPA while deciphering p-values, regression models, and null hypotheses can lead to a specific type of exhaustion: academic burnout.
This state of chronic stress doesn’t just lower your grades; it saps your motivation and affects your mental well-being. However, mastering statistics doesn’t have to be a grueling test of endurance. By shifting your study habits and knowing when to leverage professional resources like my assignment help in Australia, you can navigate the complexities of data science while keeping your sanity intact. The goal is to move from a state of frantic “cramming” to a more sustainable, “slow-learning” approach that favors deep understanding over temporary memorization.
Why Statistics Triggers Burnout
Unlike humanities subjects where you can often “write your way through” a difficult concept, statistics is cumulative and binary. If you don’t understand the fundamentals of probability, the subsequent lessons on distribution will feel like a foreign language. This “snowball effect” is the primary driver of student anxiety. When a student misses one core concept, the rest of the semester feels like a desperate attempt to catch up, leading to late nights and high cortisol levels.
Furthermore, the digital age has introduced “information overload.” Students are often bombarded with conflicting tutorials, software manuals, and lecture notes. Without a clear roadmap, the brain enters a state of decision fatigue. You spend more time deciding how to study than actually studying, which is a fast track to mental fatigue.
The Myth of the “Math Person”
One of the biggest hurdles to mastering statistics is the internal narrative that you are simply “not a math person.” This fixed mindset creates a psychological barrier that makes every challenge feel like a confirmation of your inadequacy. In reality, statistics is more about logic and storytelling with data than it is about raw mental arithmetic.
To beat burnout, you must first deconstruct this myth. Statistics is a skill, not an innate talent. By approaching the subject with the same curiosity you might bring to a new hobby, you lower the emotional stakes. When the stakes are lower, your brain is more receptive to complex problem-solving.
Strategic Delegation: The Secret to Longevity
In the professional world, high-level executives don’t do every task themselves; they delegate technical specialized work to experts so they can focus on the bigger picture. University should be no different. If you are a nursing or business student, you don’t necessarily need to be a coding wizard, but you do need to understand what the data is telling you.
| Learning Approach | Traditional “Grind” | Strategic Mastery |
| Study Duration | 6+ hours of uninterrupted cramming | 50-minute focused blocks |
| Resource Use | Only lecture notes | Diverse expert consultations |
| Goal | Passing the next quiz | Long-term conceptual clarity |
| Burnout Risk | Extremely High | Low to Moderate |
Using a strategic approach means recognizing when a specific hurdle is preventing you from progressing in your other units. For instance, if you are stuck on a complex multivariate analysis that is eating up thirty hours of your week, seeking Statistics Assignment Help through Myassignmenthelp Services can break the deadlock. This isn’t about “taking the easy way out”; it’s about expert-led learning. By seeing how a professional structures a statistical report, you gain a template for your future work, effectively turning a stressful deadline into a personalized tutorial.
Breaking Down the Complexity: The Layered Method
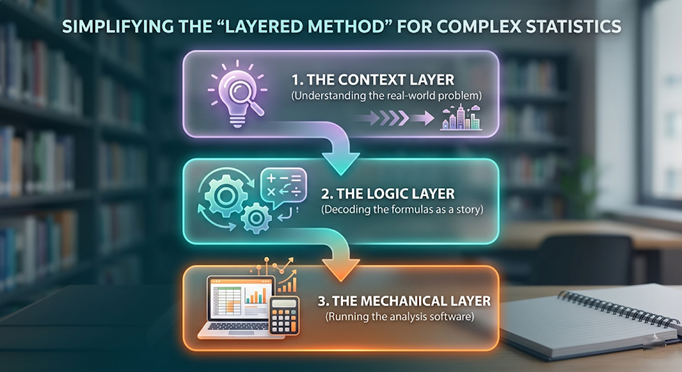
Instead of trying to learn a whole chapter at once, use the “Layered Method.” This involves three distinct passes over the material:
- The Context Layer: Read the introduction and the conclusion of the chapter first. What real-world problem is this statistical method trying to solve?
- The Logic Layer: Look at the formulas not as math, but as a sentence. What does each variable represent in the “story” of the data?
- The Mechanical Layer: This is where you actually run the numbers or the software (like SPSS or R).
By the time you reach the mechanical layer, the “why” is already clear, which significantly reduces the cognitive load and the accompanying stress.
The Role of Technology in Modern Learning
We live in an era where software handles the heavy lifting of calculation. The modern statistics student needs to be an architect, not a calculator. Focus your energy on interpreting the output. What does a “significant” result actually mean for a business or a clinical trial? When you focus on the implications of the numbers, the subject becomes far more engaging and far less tedious.
If you find that the software itself is the barrier, don’t let it become a source of burnout. There are countless communities and professional services that can help you troubleshoot the technical side while you focus on the theoretical side.
Establishing a “Slow Living” Academic Routine
Burnout often stems from a lack of boundaries. Students often feel they “should” be studying at all hours. To counter this, implement a “hard stop” time. After 8:00 PM, the laptop is closed. This creates a sense of urgency during the day and allows your brain to enter the “Default Mode Network” at night—the state where the brain actually processes and stores the day’s learning.
Physical movement is also a non-negotiable. Statistics is a sedentary, highly mental task. For every hour spent looking at a spreadsheet, spend ten minutes moving. This flushes out stress hormones and prevents the “brain fog” that leads to avoidable errors in data entry.
Navigating Global Academic Standards
In a globalized education market, the standards for statistical reporting are higher than ever. Whether you are studying in Melbourne, London, or New York, the expectation is for high-level E-E-A-T (Experience, Expertise, Authoritativeness, and Trustworthiness). This means your assignments need to look professional, cite correctly, and use the right terminology.
This global standard can be intimidating. However, it also means that the resources available to you are also global. You aren’t limited to the tutors on your specific campus. You can access world-class academic support that understands exactly what international examiners are looking for.
Practical Tips for the “Statistics-Phobic”
- Explain it to a non-student: If you can’t explain a statistical concept to your roommate, you don’t understand it yet. Teaching is the best form of learning.
- Use Visuals: Draw your own histograms and bell curves. Converting numbers into shapes helps the brain process spatial relationships.
- Don’t Suffer in Silence: The moment you feel the “wall” of burnout rising, change your environment. Go to a library, a cafe, or reach out for academic assistance.
Conclusion: Sustainability is the Key to Success
Mastering statistics is a marathon, not a sprint. The students who succeed aren’t necessarily the ones who stayed in the library until 4:00 AM; they are the ones who managed their energy effectively, sought help when they hit a wall, and maintained a healthy distance between their self-worth and their grades.
By treating statistics as a logic-based tool rather than a mathematical monster, and by utilizing professional support systems when the workload becomes unsustainable, you can achieve academic excellence without sacrificing your mental health. Remember, the goal of education is to expand your mind, not to break your spirit.
Frequently Asked Questions (FAQ)
1. Is it normal to feel overwhelmed by introductory statistics?
Ans: Absolutely. Statistics requires a different type of “brain wiring” than algebra or calculus. Most students experience a steep learning curve in the first six weeks.
2. How can I tell the difference between “normal stress” and “academic burnout”?
Ans: Normal stress ends once the assignment is handed in. Burnout is a persistent feeling of exhaustion, cynicism toward your studies, and a lack of accomplishment that doesn’t go away with a weekend off.
3. Does using academic help services actually help me learn?
Ans: Yes, if used correctly. Viewing a professionally completed assignment as a “model” or “template” can help you understand formatting, logic flow, and complex calculations better than a textbook ever could.
4. How many hours a week should I dedicate to statistics?
Ans: For a standard university unit, aim for 6-8 hours of consistent, focused study per week, rather than one 15-hour session on the weekend.
5. What is the best software for beginners?
Ans: Many universities start with SPSS because of its user-friendly interface, though Excel is often sufficient for basic descriptive statistics. As you progress, you may move toward R or Python for more robust data analysis.
About The Author
I am Min Seow, a lead academic consultant and curriculum strategist at MyAssignmentHelp Services. With over a decade of experience in higher education support, I specialize in helping students bridge the gap between complex theoretical concepts and high-distinction practical execution.